Most EB-5 program applicants understand there are long wait times associated with the process. Take China and Vietnam, for instance. Both are, as of September 2020, experiencing massive backlogs in the wake of heightened demand. That doesn’t mean every investor understands how to interpret the backlog and all the figures involved, though. In fact, processing is often complicated, messy, and nonlinear, leaving many investors frustrated while waiting. The real keys to understanding the EB-5 visa queue lie in the total number of investors in line and how quickly that line is moving. However, even these fairly easy concepts are quickly complicated by a number of factors and are difficult for the average investor to predict.
Although the totals are not set in stone, generally 10,000 U.S. visas are earmarked annually for EB-5 investors and their families (or around 7% of the total visas doled out to all employment-based visa programs). Each country is allowed only roughly 700 per year. On an exciting note, officials expect FY2021 to show an increase in allocation to the EB-5 program due to rollover from unused family visas – as many as 14,000 could be dedicated to EB-5 investors.
Due to the sheer number of participating immigrants, it is imperative that investors spend time conceptualizing the EB-5 visa queue. Unfortunately, this can be quite difficult for two main reasons:
- There are so many stages a single EB-5 investor must pass through.
- There is a marked lack of data published by United States Citizenship and Immigration Services (USCIS) at some of these stages
There are, however, a number of ways to look at the data. Take a look below and see what approach might work best for you in terms of understanding where you, as an investor, might be in the EB-5 process.
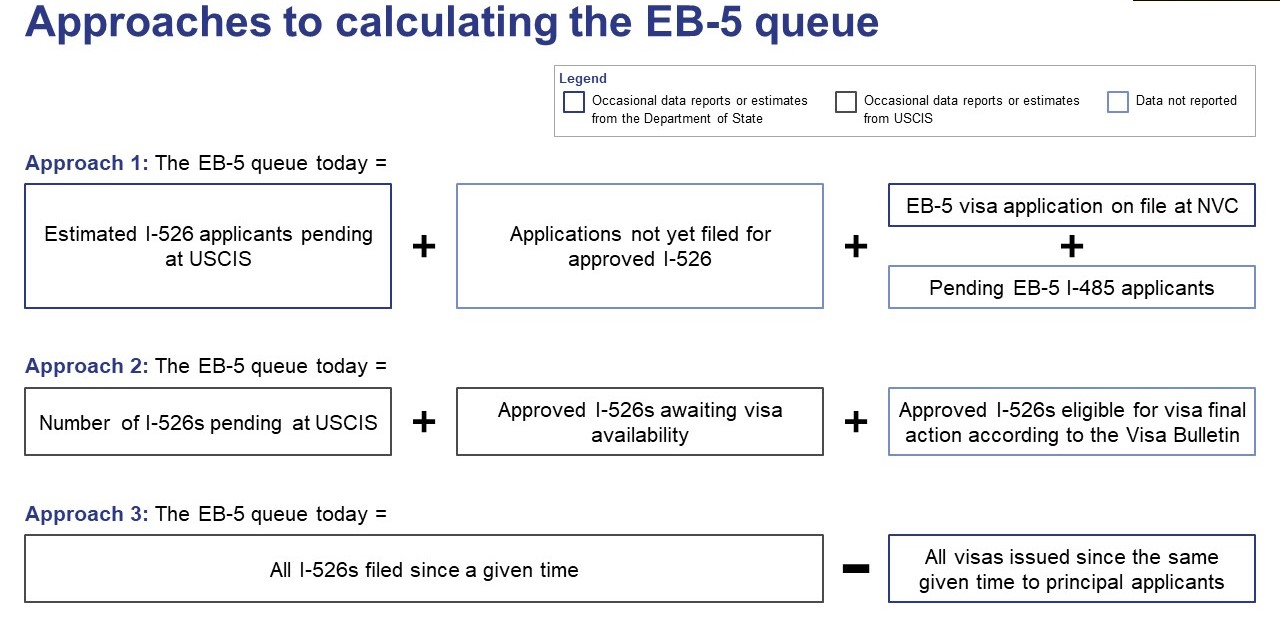
Approach 1: Oppenheim’s Calculation Method
This first approach was adopted by Charles Oppenheim, the Chief of the Visa Control Office, and breaks the queue down in terms of USCIS and Department of State. Although the data is fairly rudimentary, Oppenheim uses it to calculate estimated wait times on EB-5 visa processing. Here’s how:
Because USCIS does not collect or share data regarding investors in the EB-5 program who a) have received approval but have not submitted a visa application or b) whose I-485 applications are pending, Oppenheim omits these populations in his calculations. Thus, only EB-5 investors waiting on I-526 petitions and those with applications pending through the National Visa Center (NVC) are counted in his calculations. This can result in inaccuracies in his estimates. For example, I-485 petition totals have historically been low, and total EB-5 investors who are between the I-526 process and the visa application process at a given moment could be significant – particularly in a country like China.
Approach 2: Addressing the Gap in Oppenheim’s Approach
Looking at the EB-5 visa queue in a different way could allow an investor to address the gap presented in Approach 1 (at least partially), as EB-5 investors between the I-526 approval and visa application processes are a subgroup of all investors who hold I-526 approval and are awaiting visa availability. The second calculation method divides the queue by I-526 approval and visa availability.
Both the total number of pending I-526 petitions and the total number of approved I-526 petitions are published by USCIS. While the agency does not currently share the number of EB-5 investors who already have approval and are waiting for their priority date to become current, an EB-5 investor can glean some sense of additional delay based on how many petitions have been approved and how many visas are left to allocate among them.
Approach 3: Simplified Queue Calculations
Similar to Approach 2, but even more simplified, Approach 3 asks an investor to calculate the EB-5 visa this way:
- Choose a date.
- Subtract the total number of visas issued since then from the total number of additional I-526 forms filed since then.
Some investors prefer this method for its simplicity. Note, however, that it does not provide any nuance based on where any EB-5 investors may be in the investment process.
Sample EB-5 Visa Queues (October 2019, April 2020)
Below are tables reflecting the figures for Chinese, Indian, and Vietnamese EB-5 applicants who hold I-526 approval and are also awaiting visa availability. The first table includes data through November 12, the second is pulled from April 2020.
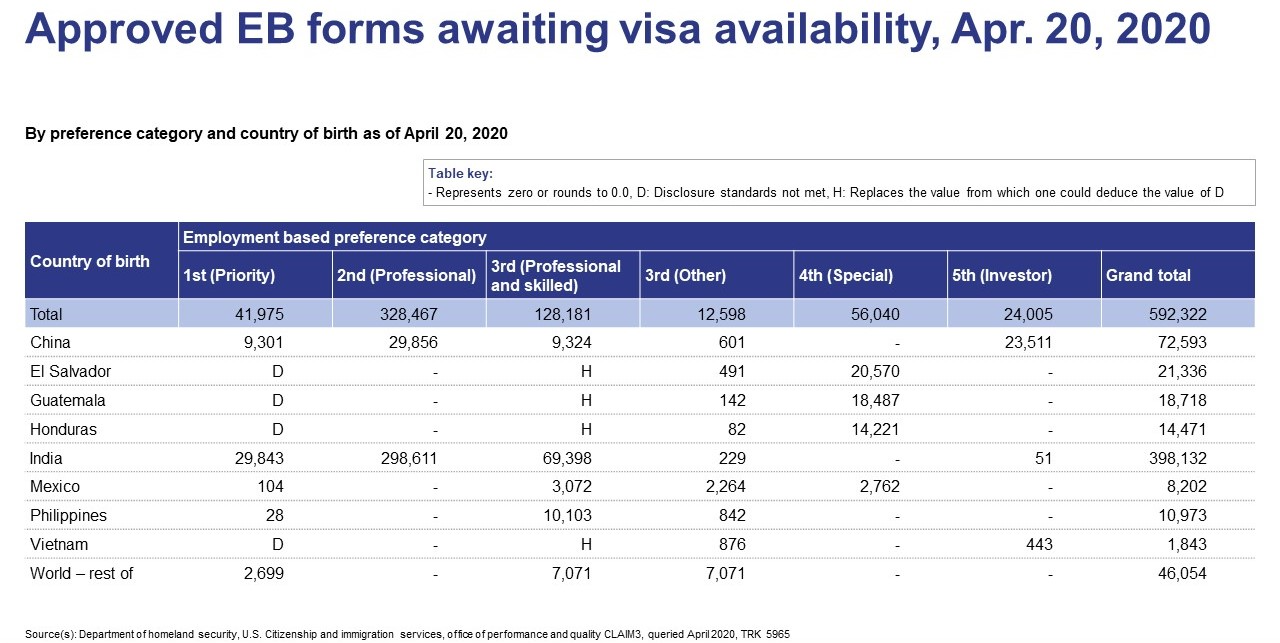
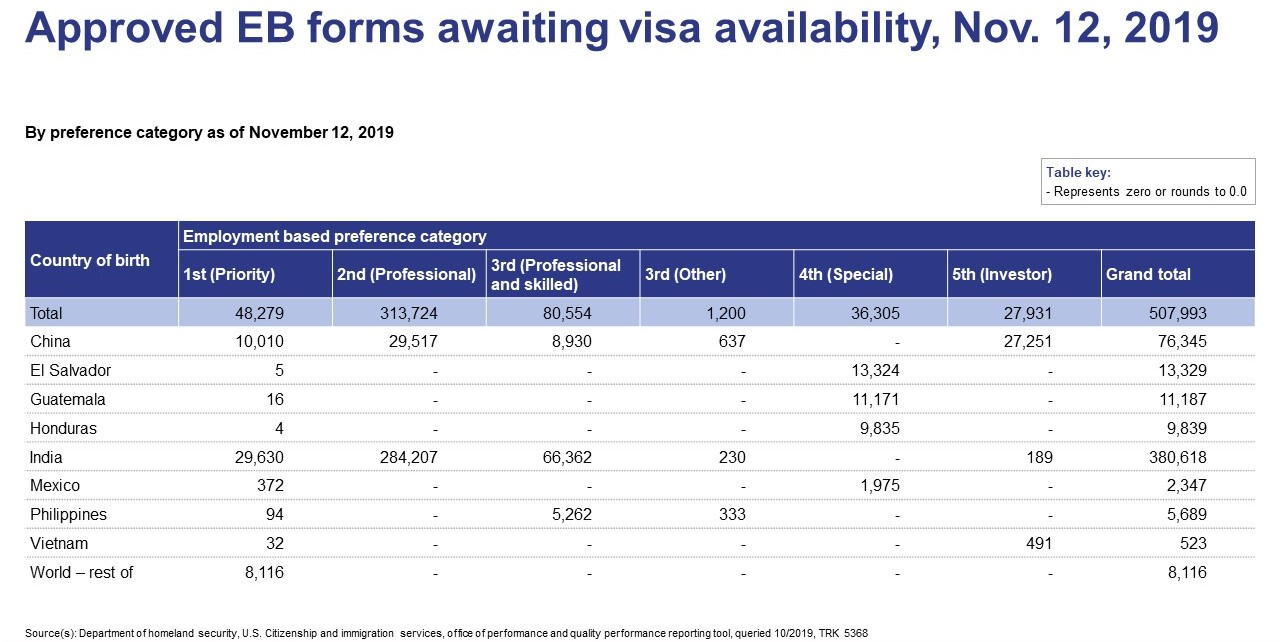
Interpreting Chinese EB-5 Visa Figures
The first distinction between the tables among the Chinese data is the drop in total Chinese EB-5 investors who hold I-526 approval and are waiting on visas to become available – 27,251 vs 23,511, respectively. Also note the leap in final action dates from November 1, 2014, to May 15, 2015. Despite the drop, this is a massive backlog of investors waiting for visa availability. The shift in final action dates, in fact, only accounts for about 13% of all Chinese EB-5 investors in 2019. The lowering of this total indicates that there are Chinese investors with access to available visas – not that thousands were able to secure them.
Additionally, keep in mind a single EB-5 investment may account for multiple visas, since many investors also apply for visas for their immediate family members. History shows that the average Chinese EB-5 investor has received 2.7 visas. So, to account for every EB-5 investor from China who is currently awaiting a current priority date, there would need to be roughly 63,889 EB-5 visas available. This is a far cry from the average 700-per-country-per-year typically allocated.
Interpreting Indian EB-5 Visa Figures
India EB-5 petition figures are significantly lower than Chinese data largely because the program has remained in highest demand in China. As of October 2019, Indian EB-5 investors topped out at 189 and maintained an I-526 approval and a priority date earlier than December 8, 2017. According to April 2020 data, the total number of Indian investors dropped even further to 51. Since then, in fact, India’s final action date has advanced all the way to a “current” final action date according to the July 2020 Visa Bulletin.
If the average number of immediate family members are factored in, then India’s 51 EB-5 investors who were waiting for U.S. green cards as of April 2020 total an estimated 124 Indian nationals. The Department of State reported in July 2020 that there were around 200 visas available to Indian investors and their families throughout the remainder of FY2020. This means there very well could be an opportunity to clear the Indian EB-5 visa backlog completely in FY2020.
Interpreting Vietnamese EB-5 Visa Figures
The difference between Vietnamese EB-5 figures in October 2019 and April 2020 was much smaller than either of the other countries in the data. Still, in April 2020, there were fewer EB-5 investors from Vietnam who already had I-526 approval and were just waiting on a final action date to become current, as opposed to October 2019. The total number of investors dropped by nearly 50, and the final action date was shifted ahead by nearly three months.
These differences suggest one of two things:
- Either a large quantity of investors saw I-526 approvals and their final action date, or
- Exactly the opposite – a small quantity of investors saw both approval and final action dates.
Oddly enough, the figures in these tables alone cannot indicate which scenario for Vietnamese EB-5 investors is accurate.
Different from India, Vietnam has not seen as massive a shift forward in final action date, probably due to the total number of visas available. When eligible Vietnamese dependents are factored in, the total estimated number of visas needed is over 800. That’s about 100 more than the total number of EB-5 visas likely available to Vietnamese nationals in FY2020.