Processing Statistics for the EB-5 Visa Program
Over the past decade, the EB-5 program has undergone various changes in the way it is processed. The program witnessed a dramatic uptake in participants during the 2010s, ending the decade with some 19,000 more petitions received, adjudicated, or pending than at the beginning of the decade. It reached a peak of nearly 50,000 in 2017 and has been on the decline since, however, so only time will tell whether the program’s numbers will remain so high. A potential reason behind the decline in the past few years is the ever-increasing backlogs at United States Citizenship and Immigration Services (USCIS), which result in applicants from certain countries waiting several years for their petition to be adjudicated. We have compiled several graphs to present a detailed overview of the trends in EB-5 processing between 2008 and 2019.
Sharp Drop in I-526 Petitions Following 2017 Peak
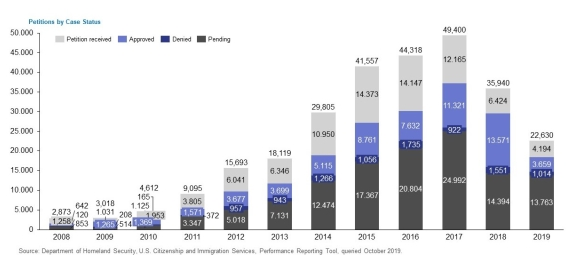
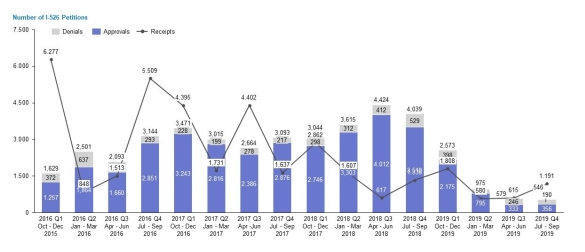
In 2008, USCIS processed (i.e., received, adjudicated, or left in pending status) less than 3,000 I-526 Immigrant Petition by Alien Investor petitions. The growth of the program is evident when this number is compared with 2019’s figure of more than 22,500. For 10 years, the number of processed I-526 increased continuously, hitting a peak of close to 50,000 in 2017. Important to note, however, is that around half of the petitions reported in 2017 were in pending status. Perhaps due to this overwhelming backlog, the number of petitions received in 2018 was only half of 2017’s figure, and the downtrend continued into 2019, falling back into numbers recorded in the early 2010s.
The small number of denials each year is also noteworthy. Every year, significantly more I-526 petitions were approved than denied, but the annual ratio fluctuates quite dramatically. 2019’s denial rate of more than 25% is in stark contrast to 2017’s rate of 8%. In addition to 2019’s high denial rate, the number of adjudications was also distinctly lower than in previous years, comparable to 2013 levels.
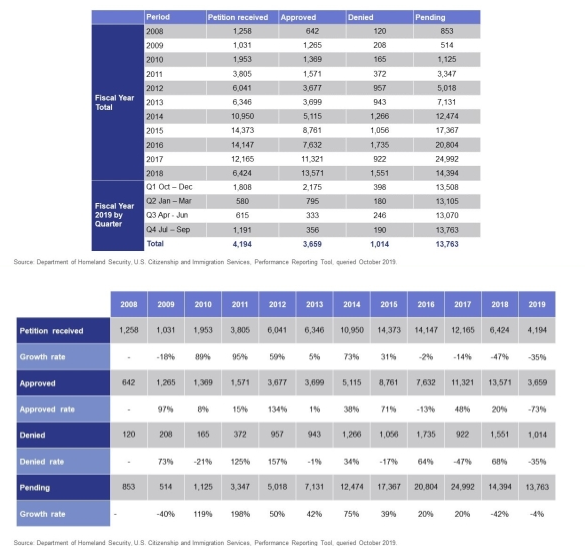
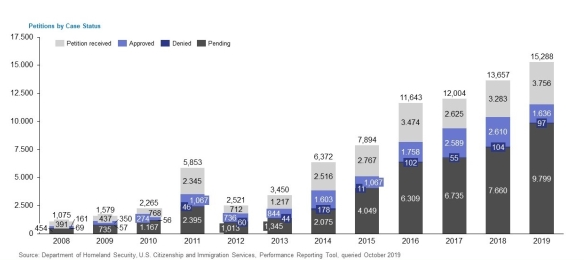
These charts illustrate the growth of the EB-5 program over the past decade. In the first half of the 2010s, the number of I-526 petitions received grew each year, usually significantly. The highest growth percentages were recorded in 2011, 2010, and 2014, with the trend continuing until a small reversal in 2016. The downtrend has continued ever since, falling dramatically in 2018, with only around half the number of petitions filed as in 2017. While the 2019 figures are significantly lower than the 2016 ones, 2019’s number of received petitions still beats the figures from 2011.
Throughout the studied period, the number of approved I-526 petitions also witnessed a general upturn. In terms of growth percentages, every single year except 2016 and 2019 recorded positive growth, sometimes significantly so, with numbers of 134% and 97% in 2012 and 2009, respectively. 2019’s massive drop—a negative growth rate of 73%—is surprising considering the generally positive trend throughout the decade. However, 2019’s low numbers are in part due to the overall low number of petitions adjudicated, with the number of denied petitions also decreasing by 35%.
Among the most significant numbers on these charts are the figures representing the backlog. The backlogs saw the most significant growth among all the measured variables, increasing rapidly between 2010 and 2017. At the peak in 2017, the number of I-526 petitions in the backlog was so high that it exceeded the total number of I-526 petitions processed from 2008 to 2013. In 2018, USCIS managed to reduce the backlog by an astounding 10,000 petitions, but in 2019, it reduced the still massive backlog by less than 1,000, with an overwhelmingly low number of total adjudications.
All-Around Decreases for I-526 Petitions in 2019
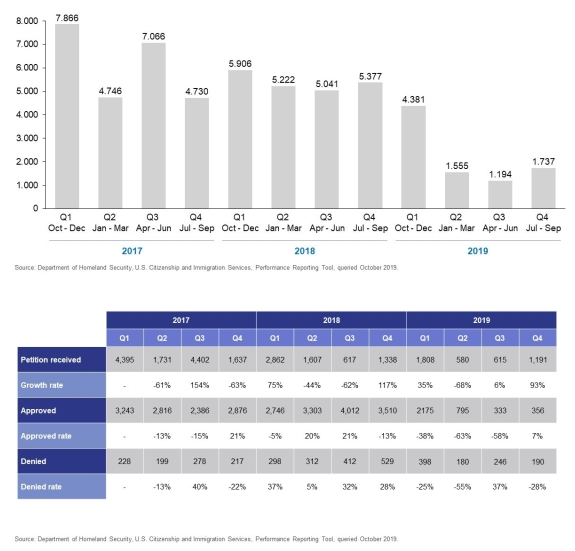
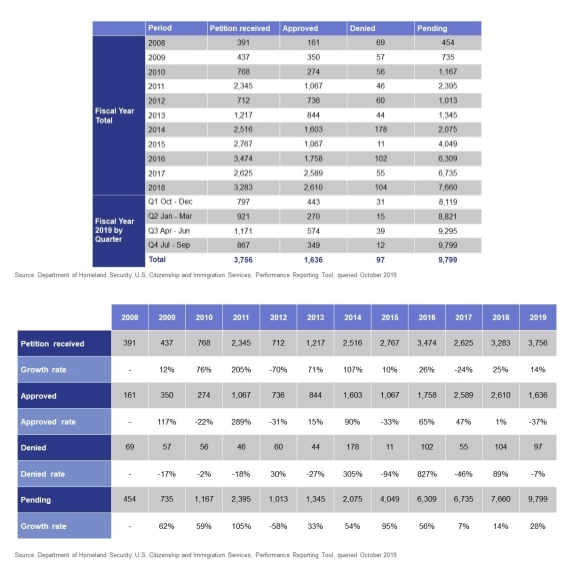
An overview of the I-526 processing statistics from FY2017 to FY2019 shows a general decrease in the total number of petitions processed, with particularly low figures in 2019. Every single figure in the “petitions received” category in FY2019 was lower than every single figure in the preceding two years, even despite a sudden drop to 617 in FY2018 Q3. The lowest two numbers were in FY2019 Q2 and Q3, with the number jumping back up to nearly 1,200 in the final quarter. The lower number of petitions received could potentially be a good thing if USCIS speeds up its adjudication process, because it could spell more backlog decreases in the future.
What is not a good sign for the ever-massive backlogs, however, is the overwhelmingly low numbers of adjudications in FY2019. While FY2019 Q1 recorded similar numbers to the previous years, adjudications saw a steep drop at the beginning of the calendar year 2019. In FY2019 Q2, Q3, and Q4, adjudication numbers were below 1,000 each time. Another important thing to note in these charts is that while the number of approved petitions fell dramatically in 2019, the number of denied petitions did not. If this high denial rate continues into the future, EB-5 investors must be careful going forward.
FY2019’s remarkably low figures are even more evident when viewed in a longer time frame. In FY2016 and FY2017, several quarters saw the receipt of significantly more I-526 petitions than were adjudicated, although the number of received petitions did fluctuate strongly throughout the entire period. However, starting in the final quarter of FY2017, the number of petitions received remained consistently below the number of adjudications until FY2019, when the number of adjudications was so low it couldn’t keep up with the low number of receipts. Adjudications reached an all-time low for the period in calendar year 2019, continuing off a steady decline from their peak in FY2018 Q3.
Continuous Growth for I-829 Petitions
In terms of I-829 Petition by Investor to Remove Conditions on Permanent Resident Status petitions, growth for the total number of petitions processed has been consistently steady, save for a sharp increase in 2011, after which figures fell back down and resumed the growth trend they had been continuing along before. The backlog followed the same trend, growing steadily to reach its highest point in the period in 2019. With the largest figure in the final year of the studied period, the growing backlog shows no sign of stopping. Regardless, EB-5 investors have continued to file I-829 petitions at a stable rate, with the largest number during the entire period witnessed in 2019.
Most figures in the quarterly chart for I-829 petitions are positive, regardless of the variable. Receipts have seen growth for all but two years—2012 and 2017—but 2012’s 70% negative growth rate is a bit misleading because it’s mainly attributable to the unusually high number of receipts in 2011, after which figures returned to normal. Other than 2011, 2014 also recorded an abnormally high growth rate of more than 100%, but the numbers did not fall again in 2015.
For the most part, the number of approved I-829 petitions also increased year by year, although no particular pattern is discernible. Four years recorded negative growth rates, including 2019, which had the largest decline at -37%. The number of denied I-829 petitions was even more varied, with some years seeing growth rates as massive as 827% and 305%. However, the number of denials tended to echo the number of approvals: Generally, if the approval rate decreased in a year, that year’s denial rate was also down. In 2019, a -7% growth in the denial rate slightly offsets the -37% growth in the approval rate.
Noteworthy is the consistent growth in the number of I-829 applications pending, as it decreased in only a single year throughout the studied period: 2012. However, given 2011’s unusual spike, the reason for the decline in 2012 is most likely the recovery from 2011’s boom. The year with the lowest positive growth was 2017, with a growth rate of 7%, which has increased to 28% by 2019. The current trends suggest EB-5 investors may have to suffer through longer waiting times going forward, as the backlog shows no sign of slowing, especially with the receipt rate remaining steady.
Remarkably Low I-829 Petition Denials
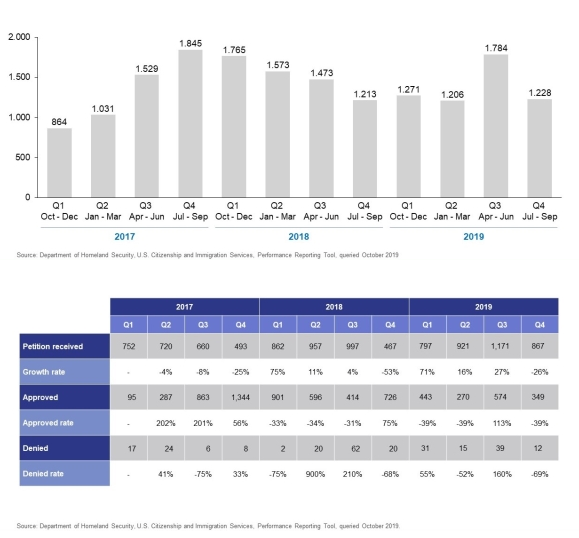
The quarterly charts for I-829 petitions paint a dramatically different picture from those for I-526 petitions. Between FY2017 and FY2019, the figures for petitions received, petitions approved, and petitions denied all remained relatively constant. The overall highest number of petitions processed was 1,845 in FY2017 Q4, but this is not a dramatically higher number than the majority of other quarters in the period. Since FY2018 Q4, the total figures have been around 1,200, although 2019 Q3 saw a sudden jump to nearly 1,800.
When the figures are broken down, we see slight and gradual growth in the number of I-829 petitions received. The most distinct figures are FY2019 Q3’s jump to 1,171, the only number above 1,000 in the entire period, and FY2018 Q4’s drop to 467, the lowest number in the period.
In terms of I-829 petitions approved, the figures vary but mostly stay below 1,000, except for FY2017 Q4. The last two quarters of FY2017 and the first quarter of FY2018 witnessed the highest numbers of I-829 petition approvals, with figures relatively low across the board in FY2019. FY2019 was marked by a negative growth rate of 39%, with all quarters except the third recording this precise negative growth percentage. In some quarters of FY2017 and FY2018, the approval rate was larger than the rate of receipt.
Denial rates throughout the period are remarkably low, which leads to misleadingly high growth percentages. The highest number of I-829 petitions denied during any quarter in the studied period is a mere 62, which is still significantly higher than the second-largest 39 and the third-largest 24. A remarkable two I-829 petitions were denied in FY2018 Q1, a stark contrast to the 901 approvals.
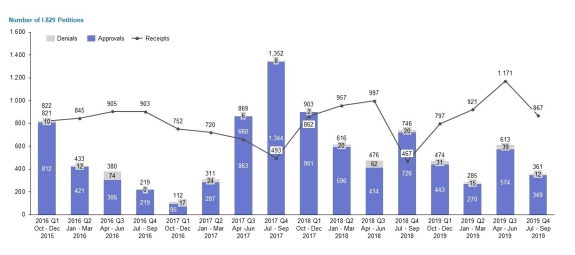
At a quick glance, you might think the bars in this bar chart of I-829 approvals, denials, and receipts from FY2016 to FY2019 only have one color: blue. In fact, most are topped with a sliver of grey to represent denials, but in most cases, the grey part is so minuscule it would be easy to overlook. It is worth noting that in the final quarter of 2016, however, not a single I-829 petition was denied. While overall adjudication rates declined steadily throughout FY2016, they shot right back up in FY2017, reaching a peak of 1,352 in FY2017 Q4. Ever since, they have fallen back down close to FY2016 levels. The receipt rate remained relatively steady throughout the period, in most cases higher than the number of adjudications. This is particularly true for FY2019, which could result in increased backlog growth.
Massive Drop in I-526 Approval Rates in 2019
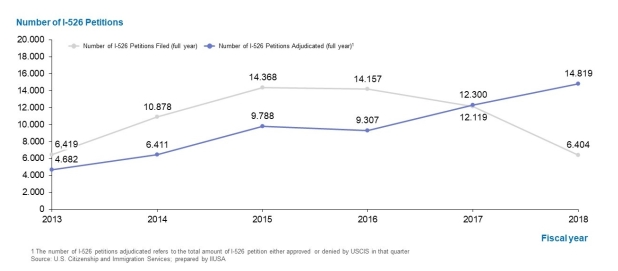
From FY2013 to FY2018, the number of I-526 petitions received was generally higher than the number adjudicated. From FY2014 to FY2016, there were consistently some 4,000 more receipts than adjudications. FY2017 was the first year where the trend reversed, but with a difference of only 181, the figures more or less evened out. The major difference came in FY2018, when the number of petitions received shot down to the lowest figure in the studied period, while the number of adjudications continued rising to the highest number during the period. The number of I-526 adjudications rose almost every year, with the exception of a slight decline in FY2016. Looking at this chart alone, one might assume the backlog continued decreasing significantly in FY2019, but FY2019’s low adjudication rate resulted in a minimal backlog decrease only.
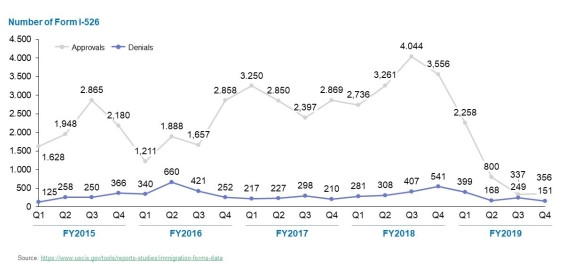
This graph showing the I-526 approvals and denials shows what is missing from the previous graph—FY2019’s critical data. It is hard to miss the steep drop in I-526 approvals from FY2018 to FY2019, reaching a record low of 356 in the final quarter. This is a far cry from the peak 4,044 recorded in FY2018 Q3. In every single year, there were more approvals than denials, and in most cases, the difference was huge. This is another pattern that ended in 2019—while approvals remained higher than denials, the difference between them shrunk to unprecedentedly low levels. In FY2019 Q3, there were fewer than 100 more approvals than denials, which is quite a contrast from the approximately 3,500 more approvals than denials in FY2018 Q3, just one year before. These figures suggest a stricter approval process from USCIS, which is something EB-5 investors ought to bear in mind when carefully preparing their I-526 petition.
The Backlog for I-526 Petitions Begins Its Descent
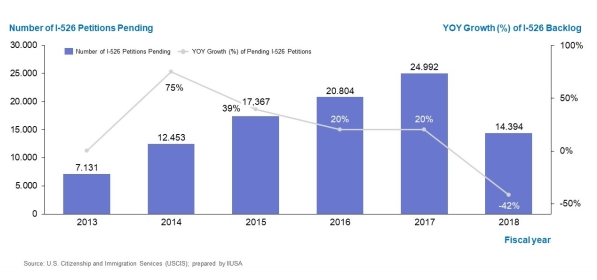
The I-526 backlogs at USCIS have been a growing issue of concern among EB-5 investors in popular EB-5 countries such as China and India. In FY2017, a record-breaking 24,992 petitions were in the backlog, forcing thousands of EB-5 investors to put their dreams of a life in the US on hold for several years. From FY2013 to FY2017, the backlog grew by roughly 3,000 to 4,000 each year but suddenly dropped by 10,000 in FY2018, sending it back down below FY2015 numbers with a negative growth rate of 42%. This chart paints a positive picture that suggests the backlogs could be cleared up in a few years, but if FY2019 data had been included, the prognosis would have been different. While the downtrend did continue into FY2019, the rate was significantly lower at only 4%. It seems the future of the I-526 backlog will depend not on the number of petitions received but on USCIS’s adjudication rates, which were staggeringly low in FY2019.
Remarkably High I-829 Approval Rates Over 10 Years
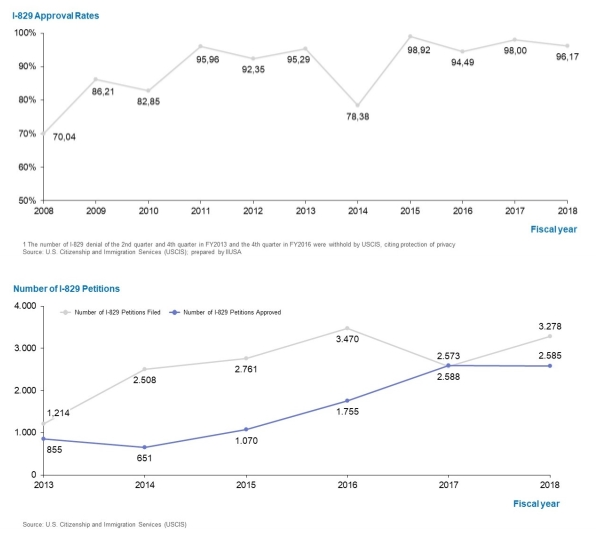
Fortunately for EB-5 investors filing I-829 petitions, approval rates are astoundingly high. In most years between FY2008 and FY2018, the percentages are in the 90s—only four years have rates lower than the 90s. In fact, other than a sudden, sharp dip in FY2014, percentages have remained in the 90s since FY2011, suggesting a favorable ratio for EB-5 investors going forward. EB-5 investors filing I-829 petitions in FY2015 were particularly lucky, as that year, nearly 99% of petitions were approved.
On the other hand, the second chart depicts how the overall picture is not all positive. For every year except FY2017, the number of I-829 petitions received by USCIS was higher—typically by at least 1,000—than the number of those approved. This is despite the approval rate growing year by year. In FY2017, the two numbers converged, but in FY2018, while the number of petitions approved plateaued, the number of petitions filed resumed growing. In short, this does not bode well for the continually increasing I-829 backlog.
Adjudications for All Petitions Low in 2019
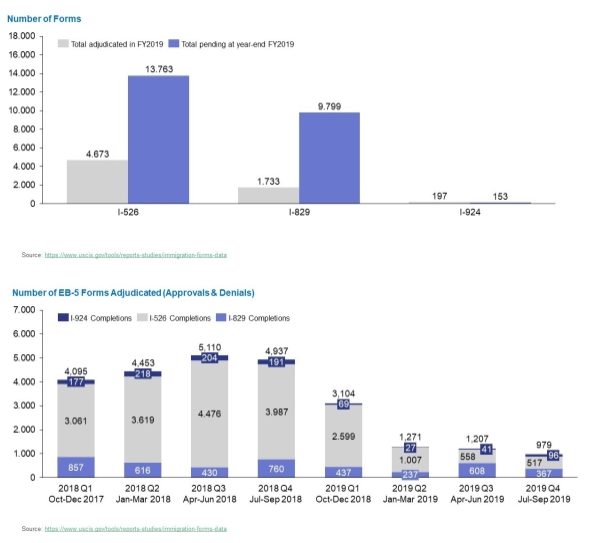
At USCIS, FY2019 was marked by a remarkably low number of adjudications across the board. Whether I-526, I-829, or I-924, not many petitions at all were adjudicated throughout the fiscal year, even though a significant number of petitions remained pending. FY2018’s large decrease in the backlog wasn’t nearly enough to quell the huge numbers of I-526 petitions pending, with the backlogs still looming over USCIS in FY2019. While the I-829 backlog is smaller in pure numbers, it is larger in relative terms, with a close to 8,000-petition difference. Only for I-924 were more petitions adjudicated than pending, but this is likely due to the overall small number of I-924 petitions processed.
When the completion numbers for all three petitions are compared over the quarterly period between FY2018 and FY2019, the most striking observation is that I-526 completion rates fell dramatically. For all of FY2018, I-529 petitions dominated the overall petition completion numbers, but starting in calendar year 2019, the share of completion numbers taken up by I-529 petitions took a dramatic hit. In FY2019 Q3, there were even more I-829 petitions adjudicated than I-526 petitions. The overall numbers are also down to around 1,000 from FY2018’s average of around 4,000. These astoundingly low completion figures spell bad news for the ever-increasing I-526 and I-829 backlogs.
Major Drop in I-526 Petitions, With I-829 Petitions Remaining Steady
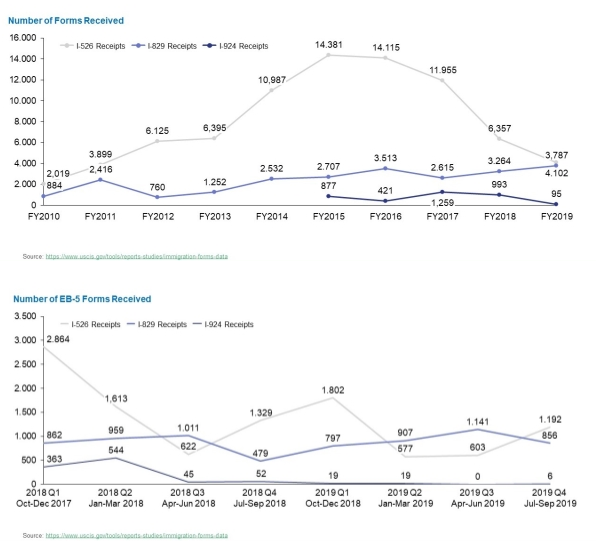
The first graph, which compares the numbers received for each of the three petitions, clearly shows that I-526 has dominated ever since the period began in FY2010. For all of the period, I-526 petition numbers have been higher than those of the other petitions, in most years significantly so. However, the middle of the decade—FY2015—marked a turning point, when the number of I-526 petitions filed began decreasing. The trend has continued ever since, with I-526 petitions dipping dangerously close to the I-829 numbers. As for the other petitions, I-829 petitions have been slowly increasing, while I-924 petitions, which have always had low numbers, also dropped sharply in FY2019.
I-924 Application For Regional Center Designation Under the Immigrant Investor Program petitions, which were introduced in FY2015, have been filed in significantly lower numbers than the other petitions in every single year and quarter. However, their already low numbers took a nosedive in FY2018 Q3, dropping by roughly 500. They never regained momentum afterward, and in FY2019 Q3, a remarkable 0 I-924 petitions were filed. The drop may be due to the new USCIS regulations, where the minimum required EB-5 investment amount was raised to $900,000 in TEA projects and $1.8 million in non-TEA projects. The new regulations also made it more difficult to achieve TEA status and have led to an unprecedently high number of regional centers being terminated, which could be scaring off new regional center owners.
While in the yearly breakdown, I-526 was consistently in first place, I-829 consistently in second, and I-924 consistently in third, the quarterly breakdown shows more fluctuation, with I-829 overtaking I-526 in certain cases. Nonetheless, I-526 petitions remained higher overall, as evidenced in the yearly graph. I-829 numbers were higher than those for I-526 for two quarters in FY2019, but the fiscal year ended with I-526 resuming its lead.
USCIS Adjudications Drop While Pending Petitions Grow
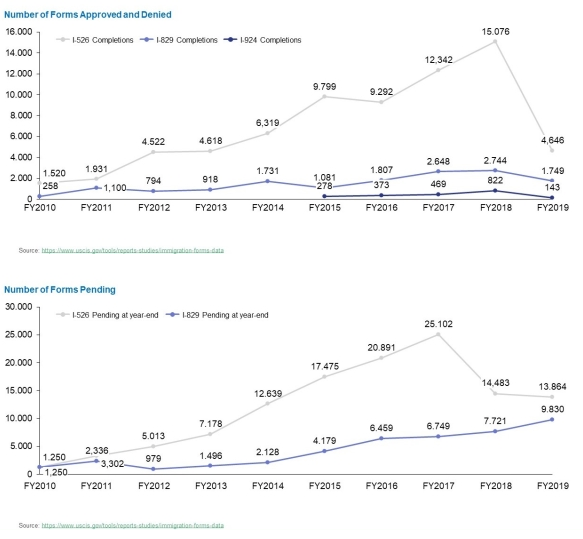
When looking at the first of these two charts, one observation becomes obvious—the steep drop in I-526 adjudications in FY2019. Adjudications dropped by more than 10,000 from FY2018’s roughly 15,000, falling back to around the same level as FY2013. This is noteworthy because prior to this steep decline, the number of I-526 adjudications had been rising more or less steadily. As for I-829 and I-924 petitions, figures remained quite steady, consistently below the I-526 figures even in FY2019, but both end the graph with a downtrend in FY2019.
The I-526 and I-829 backlogs started out exactly even in FY2010, the beginning of the studied period, but from that point, they grew at different rates, with the I-526 backlog growing significantly faster than the I-829 backlog. In FY2017, the difference between the two was a staggering 19,000-odd petitions. However, FY2017 is also where the trend finally started to change, with the I-526 backlog shrinking significantly in FY2018, although it remained far higher than the I-829 backlog. In FY2019, the I-526 continued to fall ever so slightly, while the I-829 continued its growth pattern, ending the period at its highest-ever point. Should the current trends continue, the I-829 might eventually overtake the I-526 backlog in a few years.